
Beyond correlation: what our 2017 and 2018-19 impact studies show

Two Tassomai studies go further than the simple link between using the platform and doing well. In 2017, 90% of students who completed at least 80% of their GCSE science course achieved a strong pass or better, against 68% of GCSE science entries nationally. In a 2018-19 pre and post study of 1,454 students, each student was measured against their own starting point. Gains grew with use and were largest for students who started lowest.
This post sets out what each study measured, what it found and what the results mean for schools.
Two studies at a glance
The two studies used different data and looked at different questions. The 2017 study matched GCSE results to how much of the Tassomai course each student had completed. The 2018-19 study measured each student’s progress from their own starting point.
| 2017 study | 2018-19 study | |
|---|---|---|
| Sample | 68,010 GCSE science module results | Random sample of 1,454 students |
| Period | Summer 2017 exams | September 2018 to May 2019 |
| Design | Results matched to course completion | Pre and post test on mastery questions |
| Outcome | GCSE science grades | Accuracy on mastery questions |
| Main finding | 90% of students who completed 80% of the course got a C or above | Gains grew with use, most for the lower-attaining half |
Study 1: 68,010 GCSE science results in 2017
After the summer 2017 exams, schools using Tassomai sent us their students’ results. We matched 68,010 GCSE science module results against each student’s progress through the Tassomai course. Among students who completed at least 80% of the course:
90% achieved a strong pass or better, a grade C or above
50% achieved an A or A*
Nationally, 68% of UK GCSE science entries were graded C or above that summer. That figure is our calculation across all GCSE science subjects (science, additional science, biology, chemistry, physics and other sciences) from the JCQ results tables [1].
Students who worked through most of the course were well ahead of the national picture. You can read the original 2017 results write-up.
Study 2: a pre and post study in 2018-19
The second study set out to account for prior attainment. We took a random sample of 1,454 Tassomai users across the UK who used the platform between September 2018 and May 2019.
We measured each student’s starting point from their accuracy on mastery questions in their first month of use. Mastery questions are deliberately demanding, which makes them harder to get right by guessing. We then split the sample into a lower-attaining half and a higher-attaining half.
At the end of the year, we measured accuracy on similar mastery questions again. Within each half, we grouped students by how much they had used Tassomai, measured in usage points, and worked out the average change for each group against that half’s starting point.
Results: gains grew with use
Both halves improved, and the more students used Tassomai, the bigger the gain. The gains are percentage points of accuracy on mastery questions.
| Group | Starting accuracy | Usage (usage points) | Gain |
|---|---|---|---|
| Lower-attaining half | 43% | About 10,000 | +10.7 percentage points |
| Lower-attaining half | 43% | About 15,000 | +20.0 percentage points |
| Higher-attaining half | 68% | About 14,000 | +5.9 percentage points |
| Higher-attaining half | 68% | About 20,000 | +10.9 percentage points |
Usage figures are read from the study chart below.
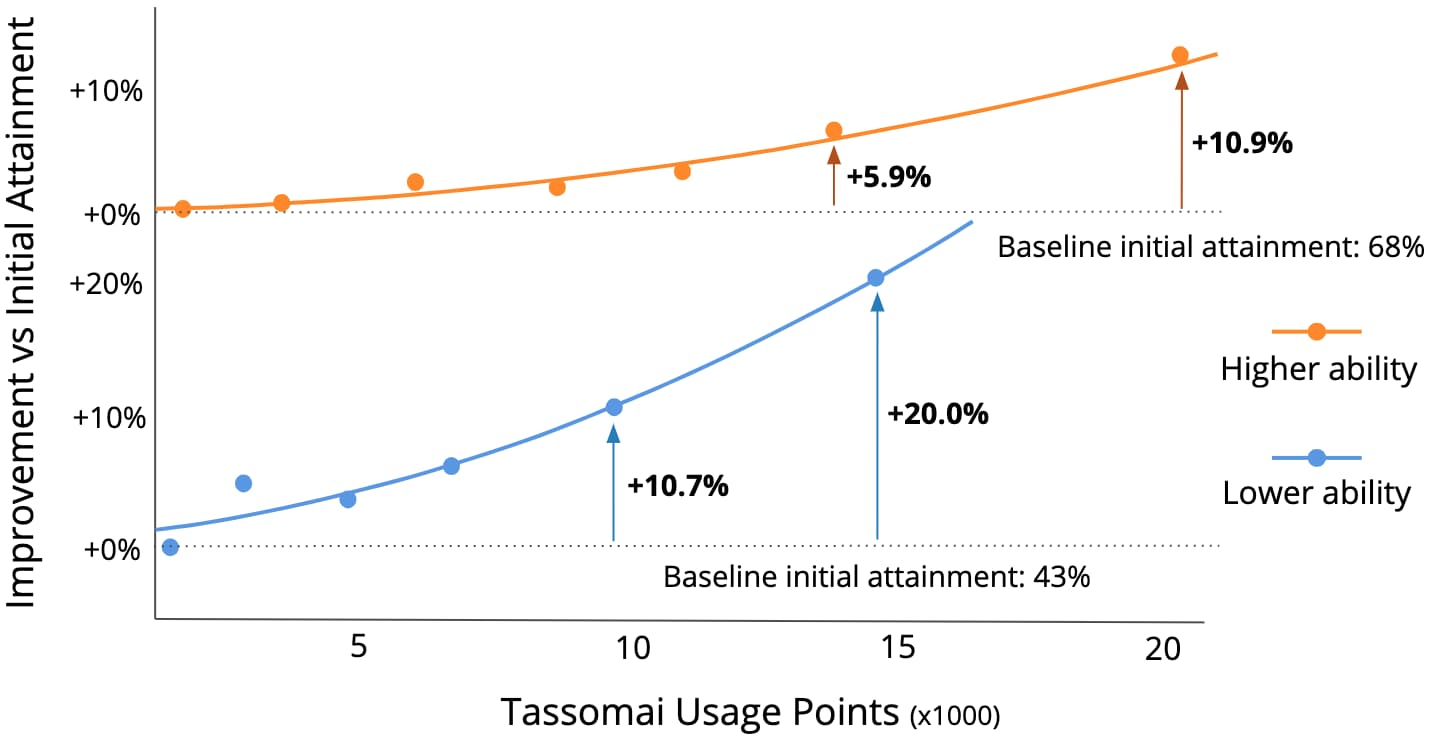
At similar levels of use, around 14,000 to 15,000 usage points, the lower-attaining half gained 20.0 percentage points and the higher-attaining half 5.9. The gap between the two groups narrowed as they used the platform. There is more on this in our 2019 write-up of the study.
Why this goes beyond simple correlation
The 2018-19 design goes further than a usage correlation in three ways.
Each student was measured against their own starting point, so prior attainment is built into the result. A strong student who used Tassomai a lot doesn’t score well just for being strong.
Within each half, gains rose step by step with usage. This dose-response pattern is what you would expect if the practice itself is doing the work.
At the same level of use, the lower-attaining half gained more. That fits the 2017 finding that lower and middle-attaining students were often the ones gaining most.
Both are observational studies of students in Tassomai schools rather than randomised trials. Our 2023/24 Pupil Premium Boost trial built on them by adding a control group of schools.
Why spaced retrieval would produce this pattern
The results fit what cognitive science already tells us. In a review of 10 common study techniques, Dunlosky and colleagues rated practice testing and distributed practice as the only two of high utility [2]. Without review, memories fade quickly: a 2015 replication of Ebbinghaus’ original experiment produced a forgetting curve very close to his 1880 data [3].
Tassomai is built around spaced and interleaved quizzes with instant feedback and adaptation. More use means more spaced retrieval, which is the mechanism the research predicts should help most.
What this means for school leaders
For schools, the two studies point the same way.
Regular use pays off. In both studies, the strongest results went with the most use, so the aim is steady, routine practice across the year.
Lower attainers have the most to gain. In 2018-19, the lower-attaining half gained up to 20.0 percentage points, the largest gain in the study, and the gap between the two halves narrowed with use.
Implementation matters as much as the tool. In 2017, the biggest difference came from teachers who built Tassomai into their routines and acted on its data.
Tassomai holds the Evidence Applied badge from UCL’s EDUCATE programme. If you would like your school to take part in future research, get in touch.
To see how Tassomai could work in your school, book a demo. If it looks right for you, we’ll set your school up with a free three-week trial.
References
Joint Council for Qualifications. (2017). GCSE (full course) results summer 2017. https://www.jcq.org.uk/wp-content/uploads/sites/2/2026/01/GCSE-Full-Course-Results-Summer-2017.pdf
Dunlosky, J., Rawson, K. A., Marsh, E. J., Nathan, M. J., & Willingham, D. T. (2013). Improving students’ learning with effective learning techniques: Promising directions from cognitive and educational psychology. Psychological Science in the Public Interest, 14(1), 4-58. https://doi.org/10.1177/1529100612453266
Murre, J. M. J., & Dros, J. (2015). Replication and analysis of Ebbinghaus’ forgetting curve. PLOS ONE, 10(7), Article e0120644. https://doi.org/10.1371/journal.pone.0120644
Tagged: Research, Impact, Attainment gap