
Does Tassomai data track mock exam results? Testing the DotScore

Teachers use the Understanding Grid in the Teacher Dashboard to decide who needs help with what, so the score behind it ought to line up with how students do in real exams. To check, we compared the DotScore, the number behind each dot, with 17,149 PiXL Wave mock exam results from 494 students across 176 themes.
We sorted the results by DotScore into 100 equal groups and compared each group’s average DotScore with its average mock exam score. The two tracked each other closely (r = 0.80). Tassomai’s founder Murray Morrison presented the analysis at the ASE Annual Conference in Reading on Friday 10th January 2020.
Background
Why we checked our own data
Assessment becomes formative when its evidence is used to change what happens next in teaching and learning [1]. If the dashboard is going to steer intervention, teachers need to know how far its numbers reflect what students can do under exam conditions. Tassomai is designed to raise attainment through spaced practice, but this analysis asked a narrower question: does the measure we show teachers agree with an independent one?
The Understanding Grid
What the dots show
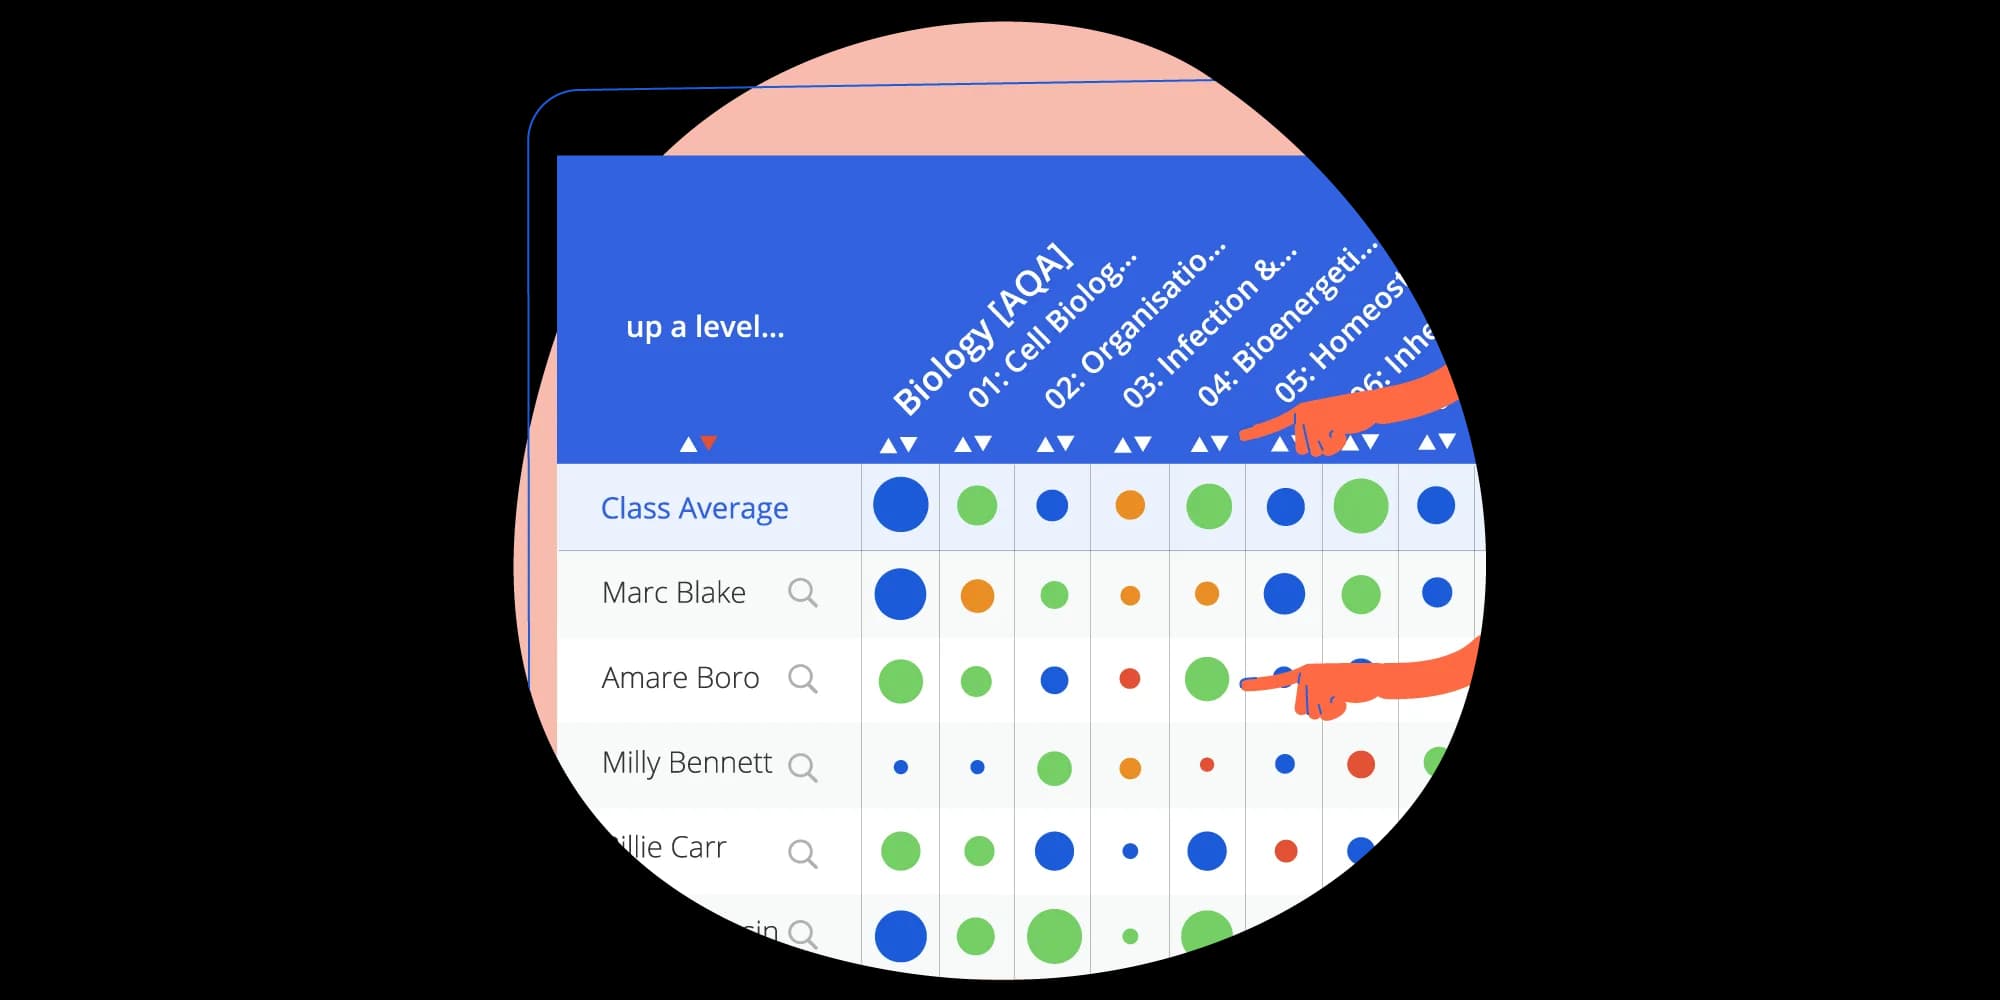
The Understanding Grid lists the students in a class against the subjects of their course. Clicking a subject’s heading opens its topics, and clicking a topic’s heading opens its themes, the smallest sections of the course. Teachers often just call it ‘the dots’. Each dot carries two pieces of information:
Its size shows how much of that content the student has seen, measured as the share of its questions they have answered at least once. A dot reaches full size when they have answered every question.
Its colour shows their accuracy, based on their last three answers to each question they have seen. Dots are red below 50%, orange from 50%, green from 70% and blue from 85%.
Hovering over a dot shows both figures as percentages, and clicking a student’s dot opens their problem questions. Our guide to the Understanding Grid explains how to move between the levels.
When a teacher sorts a column, the grid ranks the students by one number that combines the two, the DotScore:
DotScore = accuracy + 0.75 × (seen − 0.49)
Accuracy and seen are both proportions between 0 and 1, so the score runs from −0.37 (nothing seen, nothing right) to 1.38 (everything seen, everything right). Coverage counts because Tassomai adapts the difficulty of what each student sees: a student who has covered more of the course has met harder material, so their accuracy is earned on tougher questions.
| Content seen | Accuracy | DotScore | How the dot looks |
|---|---|---|---|
| 50% | 100% | 1.01 | Blue, half the area of a full dot |
| 100% | 50% | 0.88 | Orange, full size |
The first student ranks a little above the second, even though the second has covered twice as much, because accuracy carries more weight in the formula than coverage.
Method
How we tested it
The schools in the analysis took part in PiXL Wave science mock exams, and we used question level analysis to turn each student’s marks into a score for each theme. For every exam question we checked the mark scheme to see which specification points it assessed, then shared the student’s marks out across those points. Each specification point was then matched to the Tassomai theme that covers it.
That gave each student a Wave score for each theme: their PiXL Wave mock exam score on that theme. We set it against their DotScore for the same theme at the time of the mock. After removing students with no Tassomai data, the data set held 17,149 results from 494 students across 176 themes.
Plotted one by one, 17,149 results make a noisy graph. To see the overall pattern, we sorted the results by DotScore, split them into 100 equal groups of about 171 results each and compared each group’s average DotScore with its average Wave score.
Results
What we found
The correlation coefficient r measures how closely two sets of numbers move together in a straight line: 1 is a perfect match and 0 is no relationship.
Across the 100 groups, the higher a group’s average DotScore, the higher its average Wave score tended to be. The correlation was r = 0.80, a strong positive relationship.
A cluster that didn’t fit
One cluster of points at the bottom left of the graph sat apart from the main trend. Most of these were students with 0% accuracy from a single attempt at a small theme: they answered one question, got it wrong and never went back. That is a gap in engagement rather than a measure of ability, and one answer gives the system too little to go on. Low scores that do follow the main trend are a different matter. They belong to students who keep making errors without correcting them.
In the classroom
What it means for teachers
Sort a column to rank the class on that subject, topic or theme. The ranking uses the DotScore, so it counts coverage as well as accuracy.
Read size before colour. A small red dot may be one wrong answer; a large red dot is a real gap.
Click a dot to open that student’s problem questions and see what they are getting wrong.
Don’t rely on accuracy alone. Because Tassomai adapts difficulty, two students with the same accuracy may have met very different material, as our guide to using Tassomai data for assessed grades explains.
Where Group Quizzes are switched on, teachers can start one straight from the grid, using the button under each subject, topic and theme in the Group Quiz row. Our study of pre-emptive video feedback came from the same approach: using what students get wrong to decide what to offer them next.
If you would like to see the Understanding Grid with your own classes, book a demo with our team. Schools that like what they see can start a free three-week trial.
References
Black, P., & Wiliam, D. (1998). Assessment and classroom learning. Assessment in Education: Principles, Policy & Practice, 5(1), 7-74. https://doi.org/10.1080/0969595980050102
Tagged: Research, Teacher dashboard, Data, Teachers