
Data
Content in the Tassomai blog is organised by publication date and category. Click on the links below to filter content by category.
All contentNewsCase studyArticleTips for teachersTips for studentsTips for parentsTips for users
Posts tagged Data

Does Tassomai data track mock exam results? Testing the DotScore
We tested whether the score behind the dots in the Understanding Grid lines up with PiXL Wave mock exam results. Here is the formula, the method and what we found.
Read more →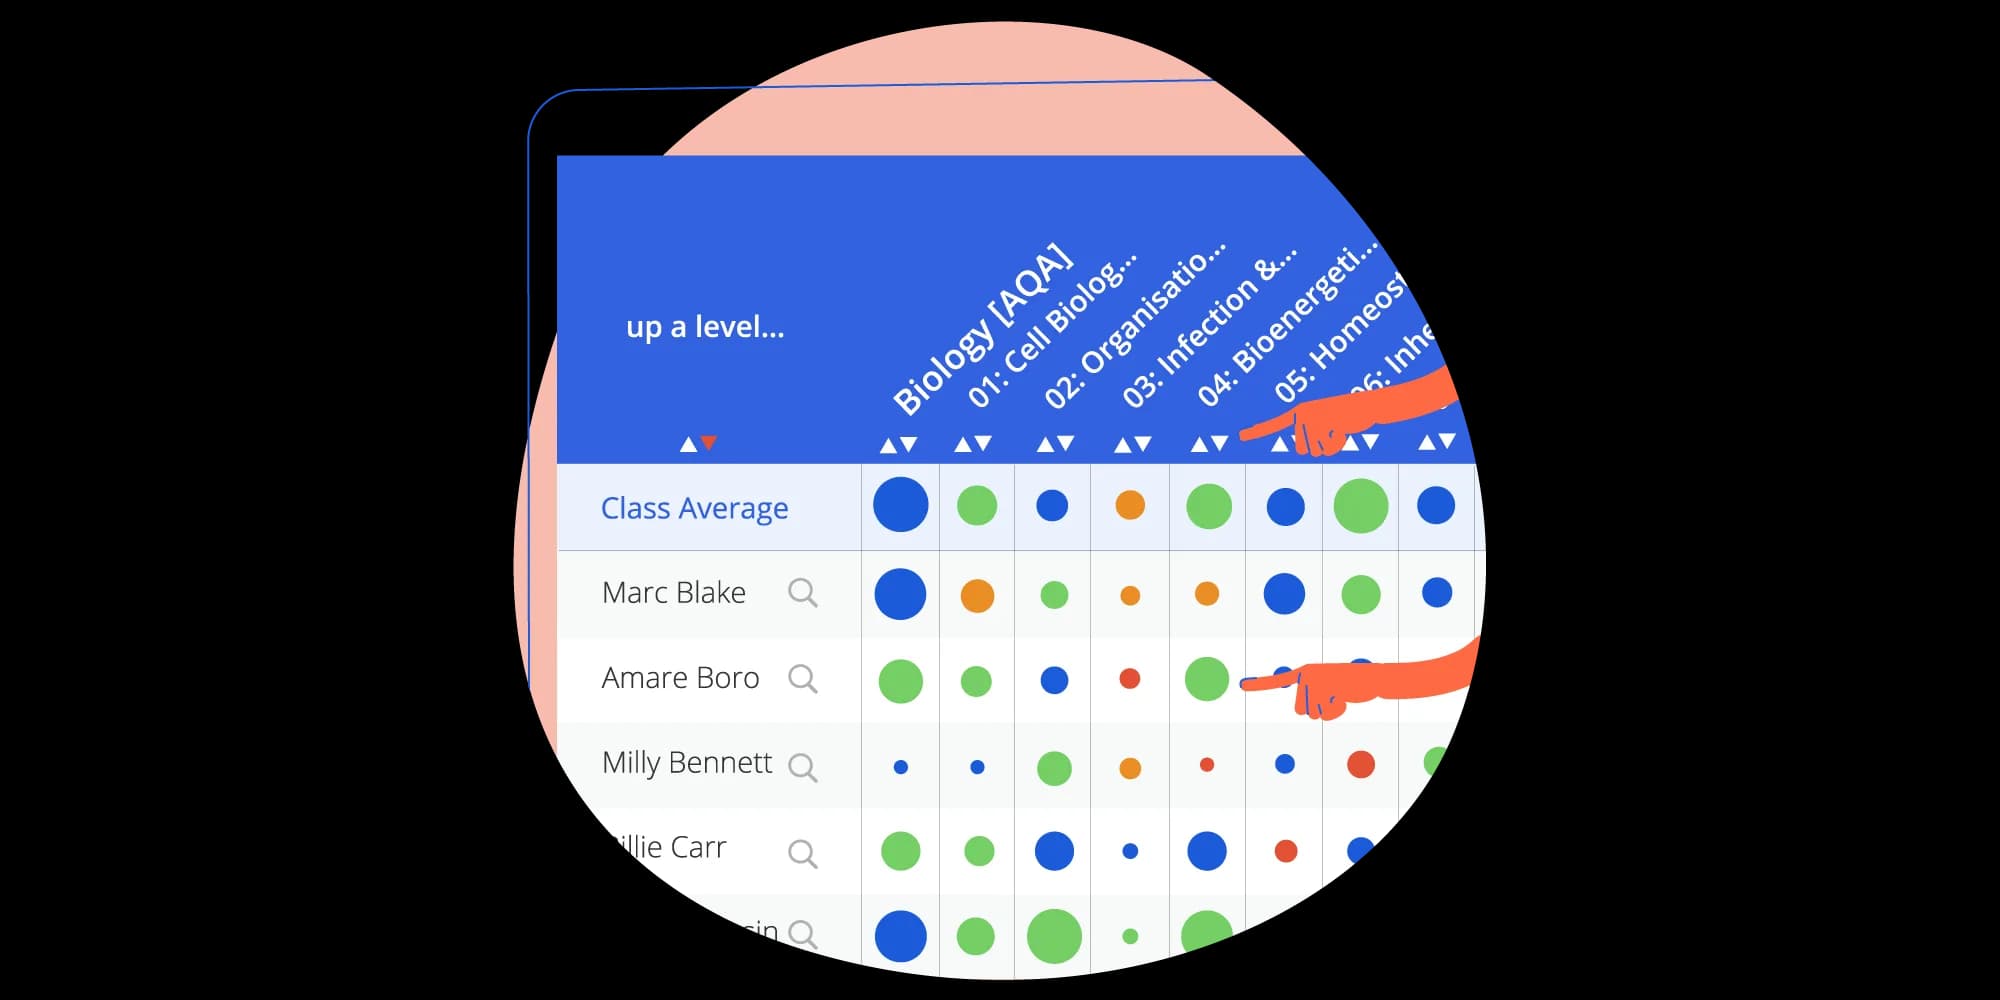
Using data-driven starters to target whole-class knowledge gaps in zero prep time
Most lesson starters test whatever was taught last lesson. How to use your class’s homework data to open every lesson on the gaps that matter, with almost no planning.
Read more →
How Class Tasks make homework less work
Holly Bradshaw , Curriculum Leader for Science at Marple Hall School , spoke to us about how Class Tasks are helping with homework setting and boosting students’ confidence.
Read more →
Ofsted's Quality of Education Framework: How Edtech Can Support Schools
Mark Barton, Tassomai’s Customer Facing Team Lead writes about Ofsted's shift towards a more holistic approach to evaluating schools and how edtech can support teachers and SLT.
Read more →
The Tassomai impact on Humanities
Clare Quarton, Teaching Team Leader for Humanities at Treviglas Academy, Newquay tells us about the impact Tassomai has had and how they’ve made homework fun, engaging and a little bit competitive for students.
Read more →
Tassomai are Education Resource Awards 2023 winners!
The Tassomai team are delighted to be winners at this year’s ERAs in the Secondary Resource or Equipment – Tools for leadership, management & assessment category .
Read more →
How students' performance improved on Tassomai - 2022 update
We’ve looked into our data to see how much students improved on Tassomai throughout the 2021/22 academic year, and the results are impressive! This post explains in detail how we calculate the performance improvement metric.
Read more →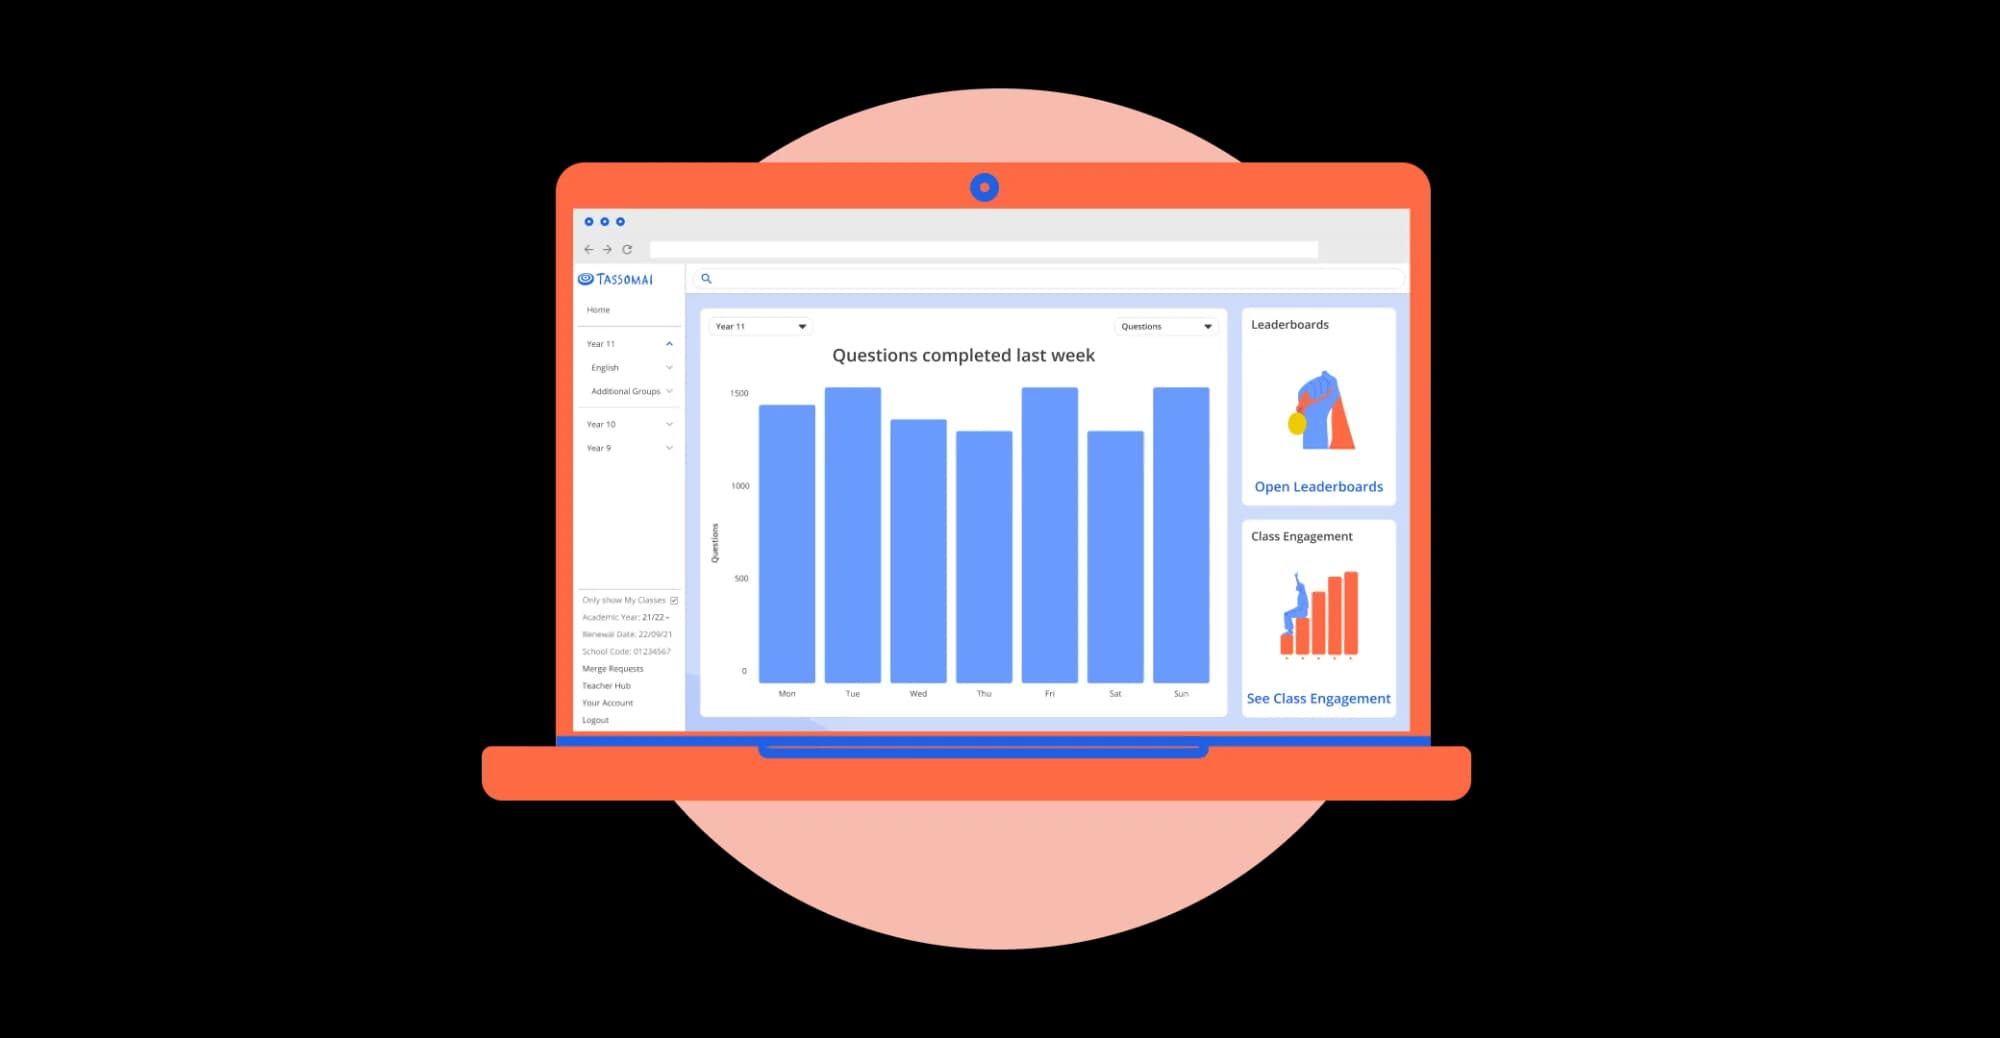
Meet your new Teacher Dashboard!
We are excited to announce an update to Tassomai’s Teacher Dashboard which we hope will make it easier and more intuitive for teachers to use.
Read more →
Using Tassomai data to improve interventions (and save time on marking too)!
Nick Cleator, Head of Science at Ormiston Bolingbroke Academy in Cheshire tells us how Tassomai data has changed his department’s approach to homework and lesson planning.
Read more →
How students' performance improved on Tassomai - 2021 update
We’ve looked into our data to see how much students improved on Tassomai throughout the 2020/21 academic year, and the results are impressive! This post explains in detail how we calculate the performance improvement metric.
Read more →
How much data does Tassomai use?
With students using technology to aid their learning more than ever before, Tassomai analyses just how much mobile data our app uses to make sure students won’t be racking up a costly bill.
Read more →
Introducing new data drops - powerful data at your fingertips!
New data visualization features for schools promise to level up implementation of Tassomai, save staff time and give teachers the means to reward students for their learning on the platform.
Read more →
Attracted to Distractors
Learn more about the theory behind multiple choice question design and why a ‘good distractor’ helps us to assess gaps in students’ understanding.
Read more →
How students' performance improved on Tassomai - 2020 update
We’ve analysed our data to see how much students improved on Tassomai throughout the 2019/20 academic year, and the results are impressive! This post explains in detail how we calculate the performance improvement metric.
Read more →
How students' performance improved on Tassomai
We analysed our data to see how much students improved on Tassomai throughout the year, and the results are impressive!
Read more →