
Dashboard
Content in the Tassomai blog is organised by publication date and category. Click on the links below to filter content by category.
All contentNewsCase studyArticleTips for teachersTips for studentsTips for parentsTips for users
Posts tagged Dashboard
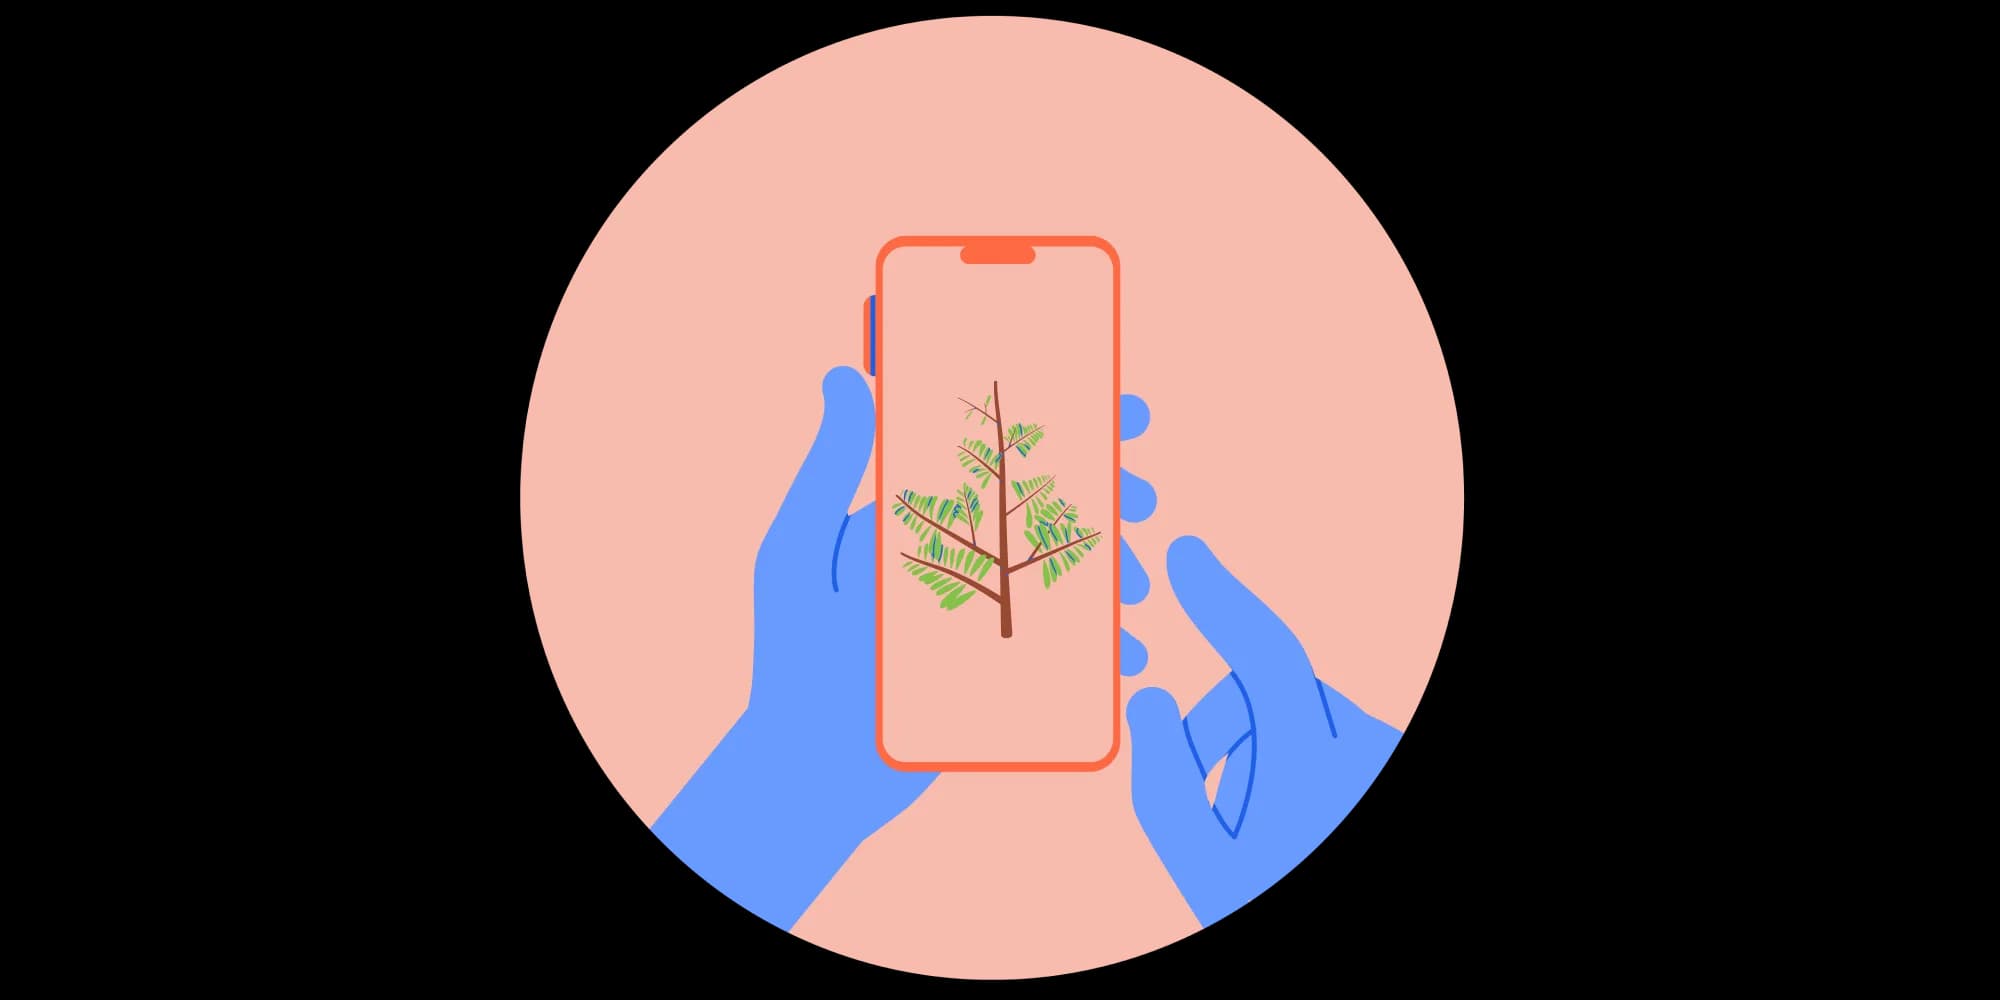
Introducing: The New Teacher Mobile App!
Teachers can now login on the Tassomai mobile app to view individual students’ data . Find out more about the changes in this article…
Read more →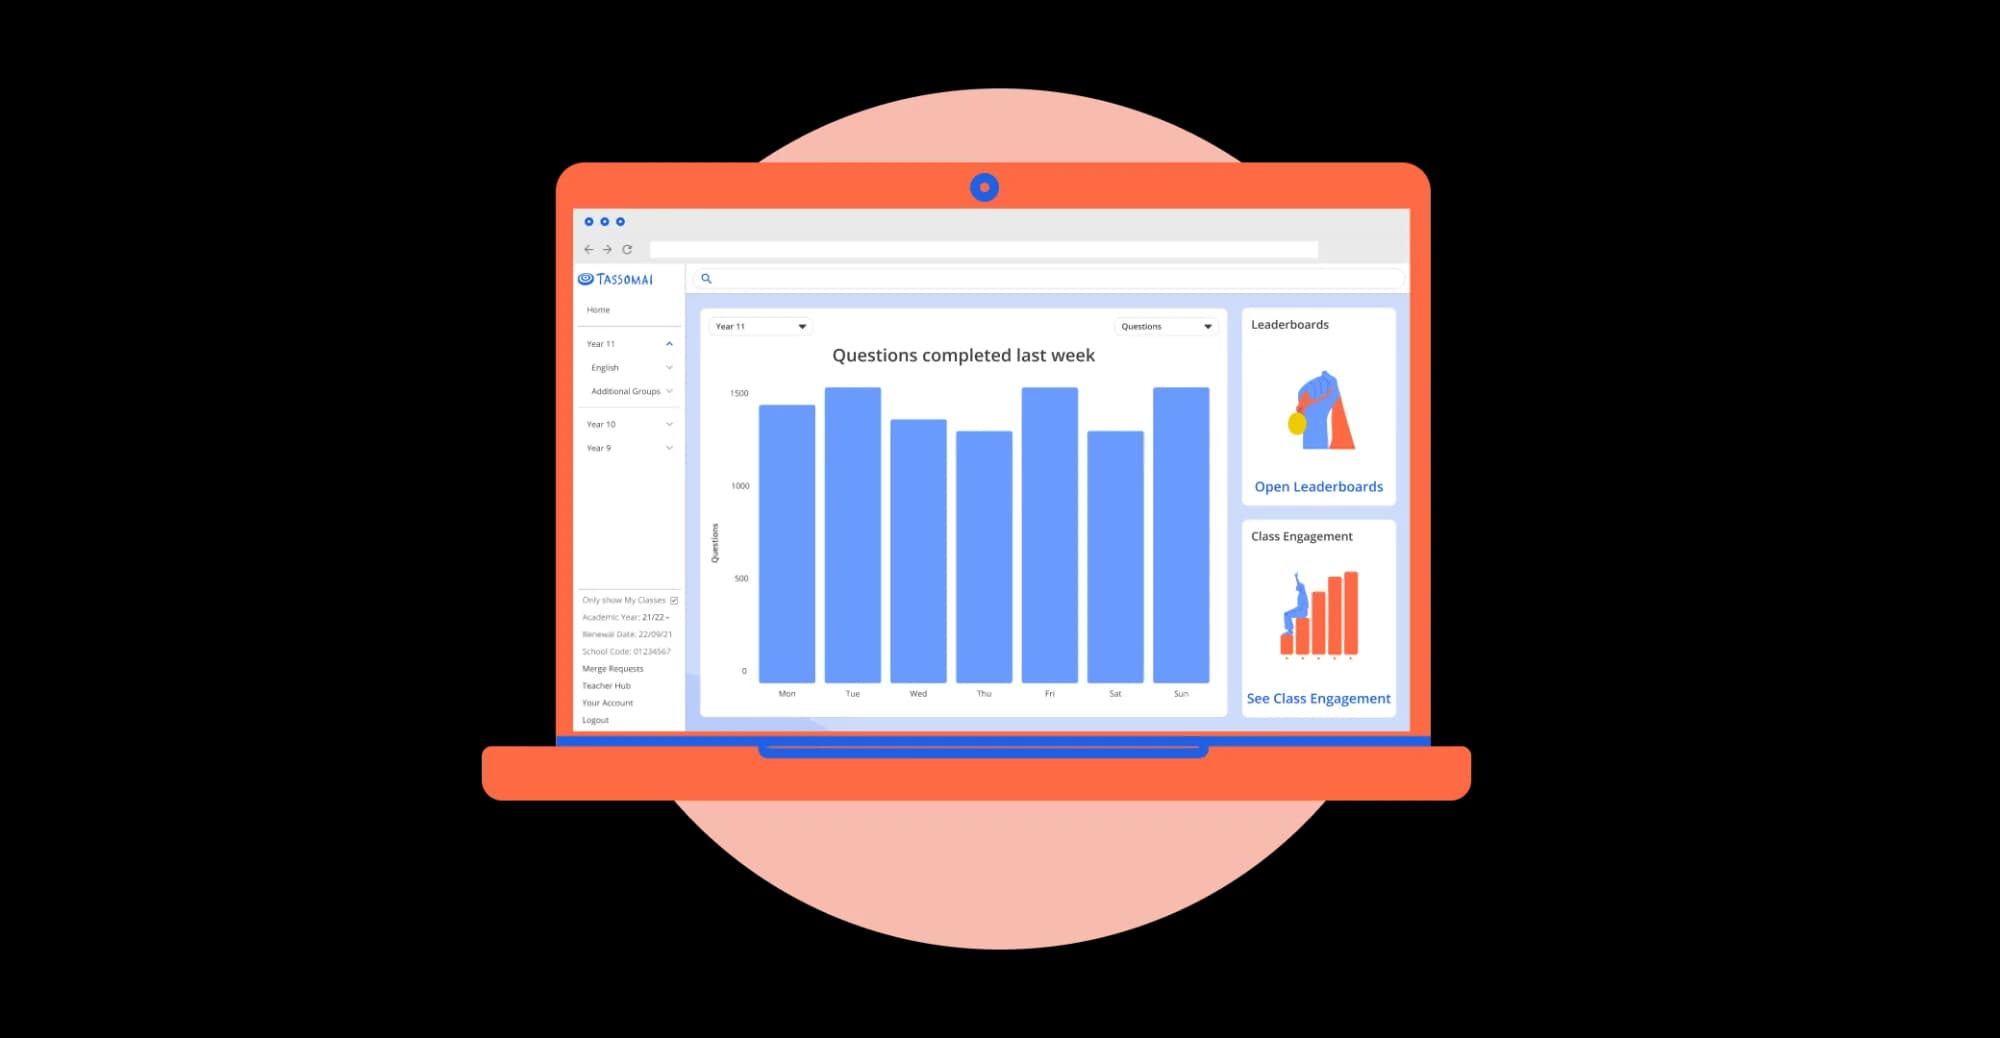
Meet your new Teacher Dashboard!
We are excited to announce an update to Tassomai’s Teacher Dashboard which we hope will make it easier and more intuitive for teachers to use.
Read more →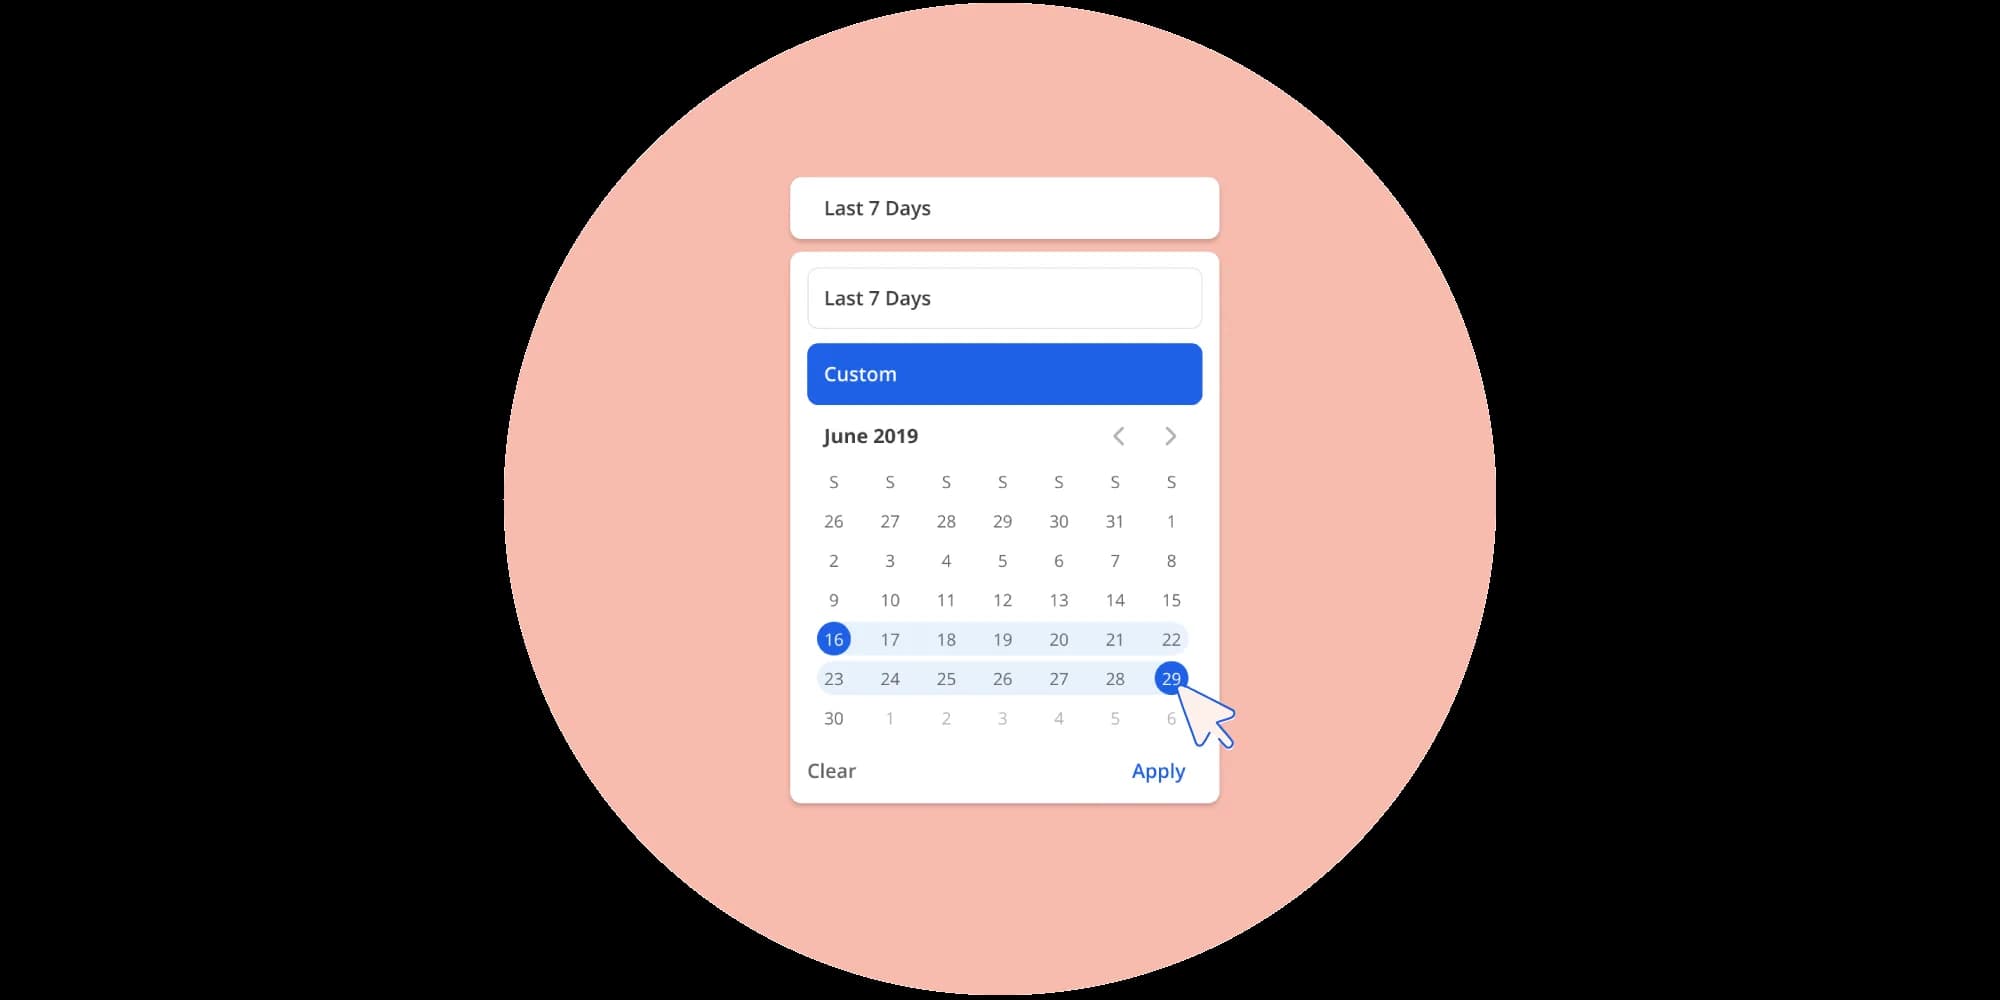
A more flexible way of viewing your students' Tassomai usage!
You asked, we listened! Your teacher dashboard is now fully customisable enabling you to view, and download, usage and performance data over whatever period you want.
Read more →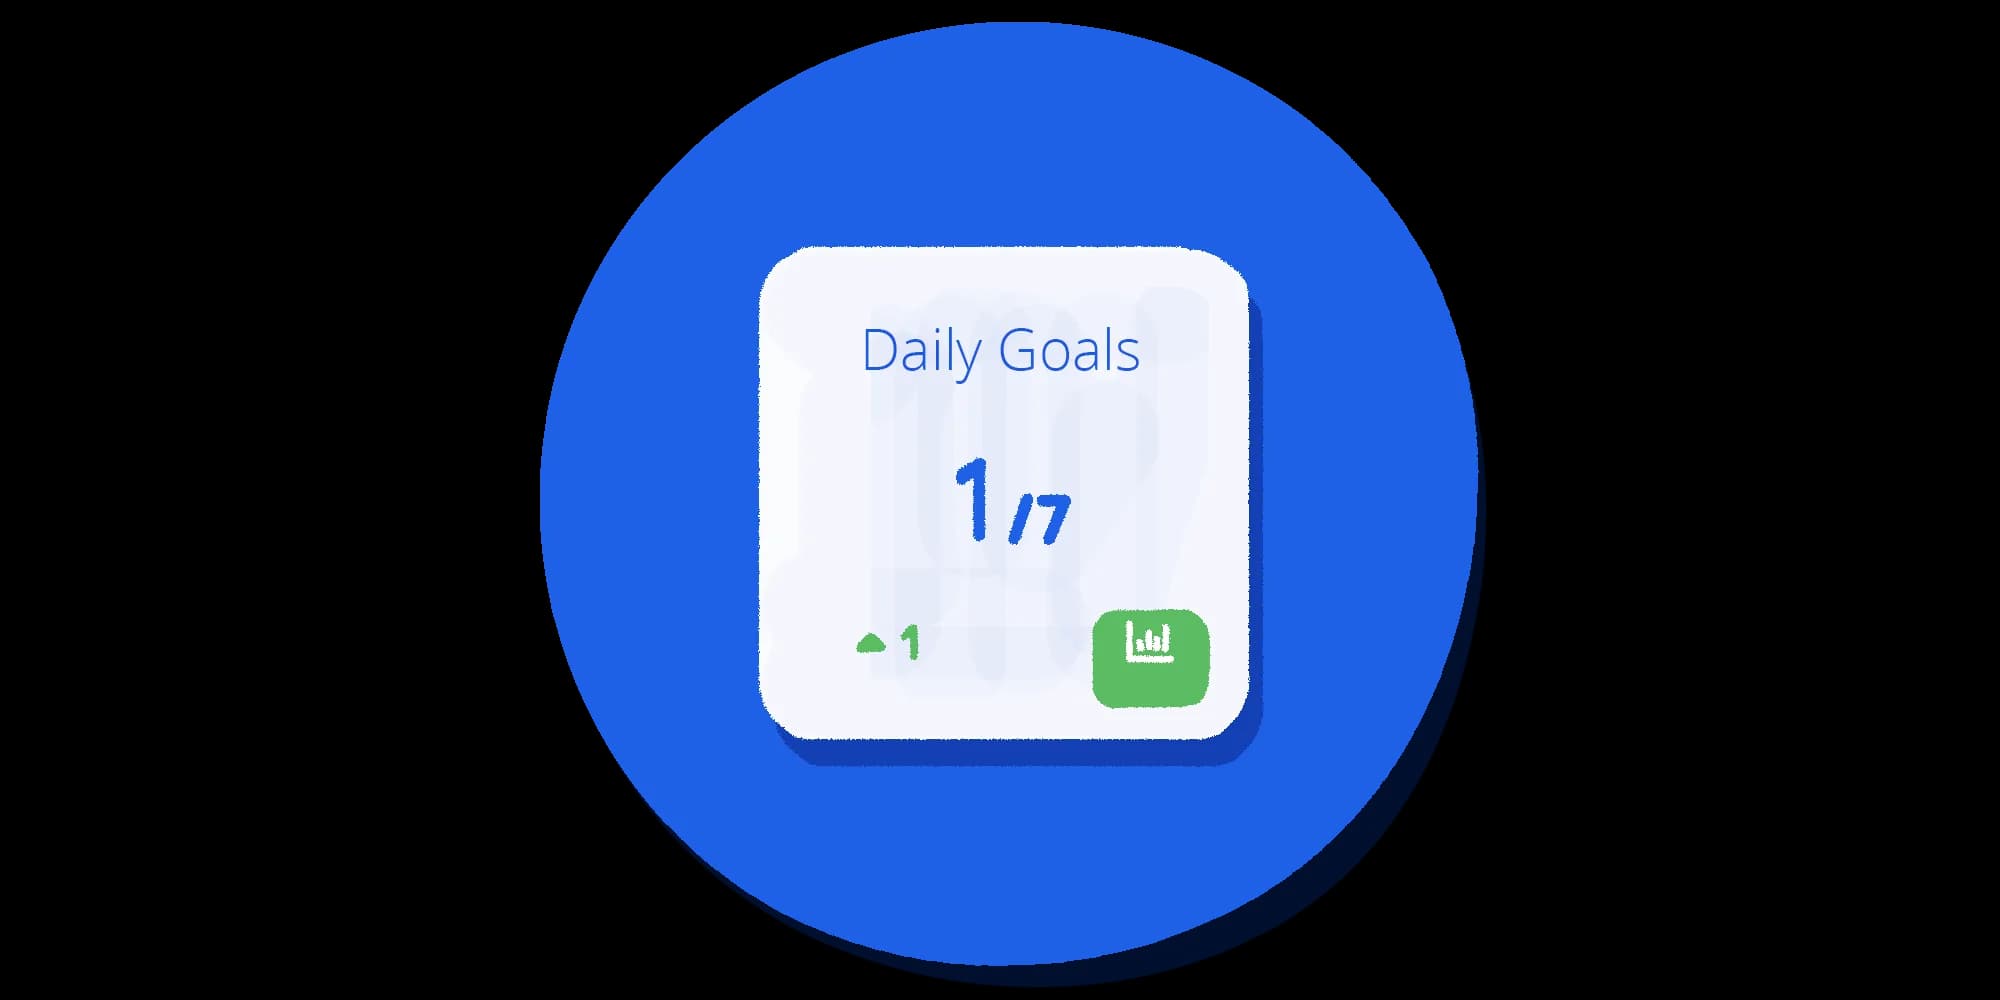
New Stats for Students
We've added a whole host of stats to the student dashboard - these let students see how they're progressing, making it easier for them to track their daily goals .
Read more →
The New Teacher Dashboard
The Teacher Dashboard has been updated; find out all about it here!
Read more →
The Understanding Grid - what it is and how to use it
The Understanding Grid instantly shows you your students’ strengths and weaknesses; find out how it works.
Read more →
The Parent Dashboard
Parents are getting a new dashboard soon - find out more about it here!
Read more →