Teacher-assessed grades - How Tassomai data can support decision making in lieu of exams
As teachers around the country face the challenge of grading their own students for a second year running, Tassomai founder, Murray Morrison, shares some vital tips on how Tassomai data can be used to support decision-making.
It’s an unpleasant responsibility to determine student outcomes when we are more used to arming them with all the knowledge and skills they need to go out and get those grades for themselves. It’s vital also that the grades given are fair and statistically realistic: as we saw in August, if the moderation process deems a school's grades too high, all students, including the most able, may find their grades pulled down.
For those schools who have used Tassomai for any length of time, the positive news is that you will have accreted a vast amount of data to help finalise grade decisions. Used correctly, our data can give you powerful insights into outcome predictions and an evidence base to support them. Having consulted with a number of HoDs the first time around, there are a few simple tips that should help get the most of your data, and avoid any false positives or negatives.
Tip 1 - On Tassomai, ‘Accuracy’ can be misleading
The most important factor to bear in mind is that Tassomai is highly adaptive as a program, so continually adjusts the difficulty and spacing coefficients of students’ content in order to give each the right “goldilocks zone” level of challenge or difficulty. Therefore, one student of lower ability may have foundational-level content frequently repeated while their counterpart of higher ability is seeing far more challenging material with greater spacing. Long story short, both students may have similar levels of accuracy, but mean very different things. Consequently, we’d advise strongly against using student accuracy as evidence of potential grade outcome.
Tip 2 - Judge course progress judiciously
By a similar token, different use cases (such as implementation strategies or student engagement) can result in different rates of course completion. We have an enormous amount of evidence from various randomised trials that show that students with a high amount of course coverage (over 25%) will tend to receive grades above the median for their cohort. It’s extremely rare for a student with progress greater than 50% to receive below a 4-5 grade, and likewise extremely likely that they will match or exceed their predicted grade.
The converse is not true: low progress on Tassomai is not an indicator of lower ability or lower predicted outcomes - it could simply indicate that that Tassomai was not pushed as a homework in their class, or that they deliberately ‘spammed’ the program by constantly repeating a single topic quiz rather than following the algorithm’s balanced program.
As a rule of thumb, regardless of prior attainment, students with a course progress of 25% are more likely to meet or exceed targets; below 25% doesn’t tell you very much.
Tip 3 - The Understanding Grid is the best way to support your rankings
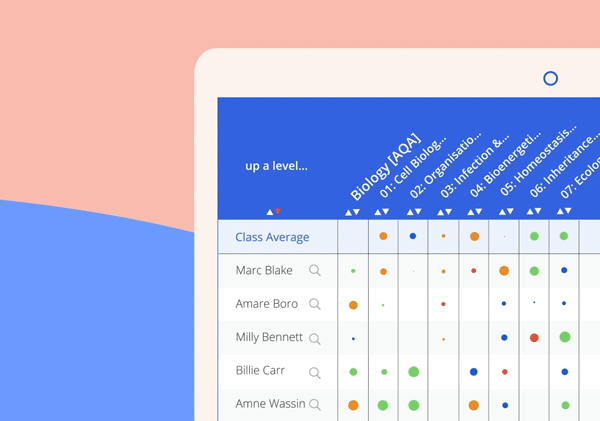
Rather than using the stark, raw numbers you find in the dashboard around ‘usage’, we’ve found that the Understanding Grid (“the dots”) is far more informative. It also has compelling evidence from research to support it.
The Understanding Grid can be viewed class by class, and also across an entire year group, so makes the task of ranking a cohort far easier.
Rather than relying solely on accuracy or solely on progress, the dots combine the two in a weighted statistic. If you use the ranking arrow at the top of a column - for example, rank by Biology - you’ll notice larger green dots rank higher than smaller blue ones. This is because the student with a larger dot will have ‘unlocked’ the tougher content. Their accuracy may be a touch lower accordingly, but the expectation is that they will have better prepared themselves to succeed in the exam.
We recommend that you rank students by each subject using the little arrows at the top of the column - this then sorts by a weighted measure of their performance across the whole course - and do so class by class as well as by cohort since those doing foundation courses may suffer in the comparison against those doing higher tier.
This 2 minute video will guide you through the Understanding Grid.
Research and Evidence
In 2018-2019, we undertook a trial with 500 students across 12 mock papers in November and February (some 6,000 independently assessed scripts) and correlated their marks in each question with the relevant dots on their understanding grids at the time of assessment; the research, presented at the ASE in Jan 2020, showed a very high correlation between our ranking and their attainment in the examination - enough to give us great confidence in the validity of the results.
There were, however, some instructive outliers which are of note to you: those students who appear on the very bottom of your ranking will be those with very small or non-existent dots. They, again, are like the low-progress exceptions: they didn’t do enough Tassomai to show a true level of ability. Therefore we’d recommend against inferring a lower ranking simply from their lack of Tassomai data.
If you’d like to find out more about this piece of research, I’m happy to show you the data and discuss the findings.
Use Tassodata to provide nuance in your rankings, and to provide supportive evidence
One of our Tassomai Ambassadors, conducting the process in his school in 2020 gave the following advice:
Tassomai performance data could be used with caution as an indicator to justify a slightly higher ranking place within a grade profile, e.g. 4-3 , 4-4. This would give them greater security in grade, as standardisation is most likely to influence the lower rank end with 4-3, 4-4, being most contentious. 4-4 is significant within Gov stats follow up.
While we wouldn’t advise using Tassomai as your sole means of grade assessment, it does provide a superb body of evidence for you to give some hard-working students a grade that shows an improvement on the last sample-point - mock or prediction.
Anyone reading this will have a few students in mind who they know were putting in the hard yards to get a grade to exceed expectations; if Tassomai data shows that they were practising, improving, and getting ready for the exam in the right way, then I hope this can be the evidence you need to give them what they deserve.
Again, our Tassomai Ambassador:
Tassomai is also significant in the mocks with significant individual improvements attributed to it. Also with no test data, Tassomai is central in our attitude to learning assessments across the school. Our data is tighter and sharper as a result of using it. For example a pupil in November mock on 3-3 and poor individual effort on Tassomai was unlikely to progress to 4-3 and thus that was our progress grade.
Here to help
I am happy to look through your data with you over screen share at a time that suits you: if you click the link, you’ll be taken to a booking system where you can pick a timeslot and we’ll go through it together.
I realise you have a million things to think about, but I’ve been looking at these data screens for years…! If I can be of any assistance looking through what we have, I’d be only too happy to help.
If your school isn’t already using Tassomai, click here to arrange a demo and to find out more about our free 5-week trial for schools.

Tassomai founder Murray Morrison

Watch Murray’s data training webinar for Tassomai teachers.